DevTools panel that exposes OutSystems app state inside Chrome
OutSystems Toolkit by Leonardo Fernandes is a Chrome extension that connects Service Studio's visual model with the browser runtime for troubleshooting. It places an OutSystems panel inside Chrome Developer Tools to inspect Reactive and Mobile applications in real time, giving direct access to variables, data sources, screen structure, network mappings, and environment metadata. The extension targets professional OutSystems developers, technical leads, and QA engineers who need faster in-browser diagnosis during development and testing.
What the Toolkit is meant to do for OutSystems debugging
The Toolkit is a browser extension built specifically for the OutSystems low-code platform, adding an OutSystems panel to Chrome Developer Tools so developers can work within the browser rather than switching tools. It is designed for Reactive Web and Mobile applications, and its stated purpose is to bridge Service Studio's visual logic with the actual runtime the browser executes.
How it exposes client-side state to speed problem tracing
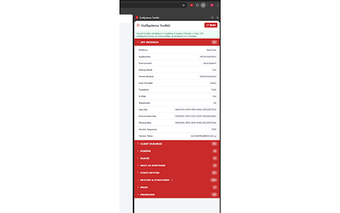
Inspection focuses on runtime artifacts that usually require multiple tools to observe. The extension surfaces:
hierarchy of screens and blocks
screen and client variables in real time
status and results of Aggregates and Data Actions
translated platform network requests for easier reading
Those items make client-side data flow and UI state visible without decoding raw requests or DOM alone.
How it fits into existing developer workflows and platforms
Deployment targets Chromium-based browsers, so it installs directly into Chrome and compatible engines. The Toolkit runs on desktop environments (Windows, macOS, Linux) supported by Chromium browsers and displays module, version, and environment metadata inside the DevTools panel. That placement keeps inspection within the browser session used for manual testing and quick verification steps.
Who benefits and why the author's background matters
Designed for professional OutSystems practitioners, the extension explicitly targets developers, technical leads, and QA engineers working on Reactive and Mobile projects. The developer, Leonardo Fernandes, is an OutSystems MVP and Head of Delivery at PhoenixDX, a background that aligns the tool's focus with common platform debugging needs and with other community utilities he has produced for the OutSystems ecosystem.
A focused utility best suited to OutSystems development teams using Chromium browsers
OutSystems Toolkit is a focused productivity tool for teams who run and test OutSystems applications inside Chromium-based browsers, and it reflects community-oriented design given the author's OutSystems MVP standing. The principal trade-off is browser compatibility, because the extension targets Chromium engines only. Teams should confirm their developers use Chromium browsers before adopting the Toolkit as a standard debugging aid.
Pros
Adds an OutSystems panel to Chrome Developer Tools for in-browser inspection
Exposes Reactive and Mobile app structure, variables, and data sources
Translates platform network requests into a readable format
Shows module, version, and environment metadata inside DevTools
Cons
Available only on Chromium-based browsers
Purpose-built for OutSystems apps, not general web debugging
Aimed at developers and QA, not end-user testing workflows
Laws concerning the use of this software vary from country to country. We do not encourage or condone the use of this program if it is in violation of these laws. Softonic may receive a referral fee if you click or buy any of the products featured here.